# Navigation for Image Processing
## Why Use Images in Spatial Analysis
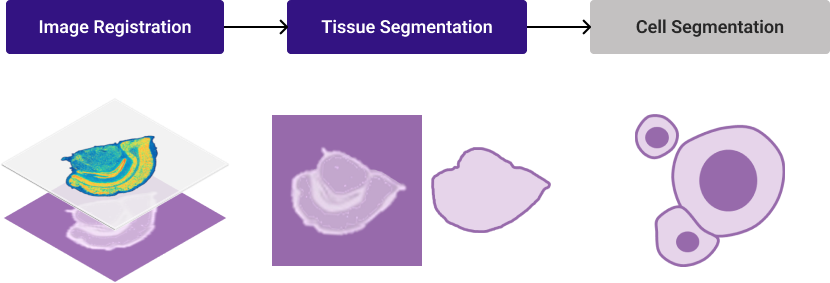
The expression level of features (such as RNA and proteins) on clinical tissues might be uneven, making it challenging to identify tissue boundaries accurately solely based on the spatial feature expression density heat map. However, microscope images of cell nuclei (such as ssDNA fluorescent staining or DAPI staining) or tissue hematoxylin and eosin (H\&E) staining can clearly show the whole tissue region. The use of staining images can significantly improve the outlining of tissue or even cells. After determining the boundaries, precisely align the image with the density map and use the boundary information to obtain a subset density map of tissue or cell region for further analysis.
Basic Stereo-seq image processing logic
## Image Types and Format
Here is a summary of StereoMap and SAW support image input types and formats:
Image Types
Image Format
Magnification Objectives
Stereo-seq Chip Size
Nuclei-staining image
e.g. ssDNA, DAPI
8 or 16-bit grayscale single-page image
10X
Up to 2 cm x 3 cm
Nuclei-staining + immunofluorescence image
e.g. DAPI + up to 6 IFs
8 or 16-bit grayscale single-page image
10X
Up to 1 cm x 1 cm
Hematoxlin & Eosin (H&E) staining image
24-bit color image
10X
Up to 1 cm x 1 cm
{% hint style="warning" %}
The nuclei-staining image and IF images **must be grayscale images (8-bit or 16-bit)**. Otherwise, the images may not be correctly recognized during Image QC.
{% endhint %}
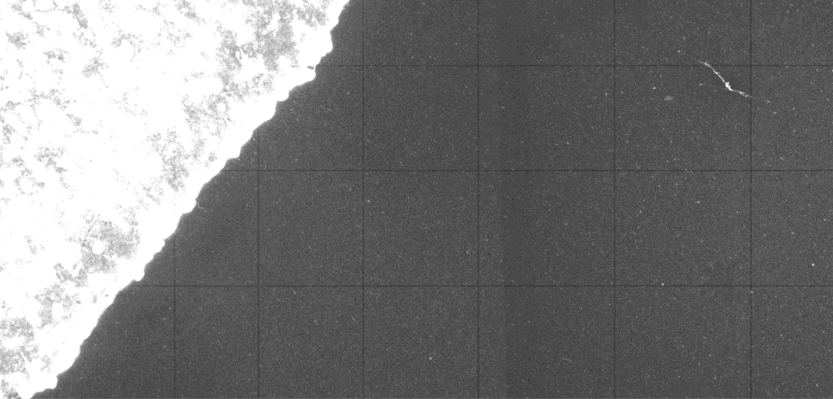
The Stereo-seq chip surface contains **tracklines** — **horizontal and vertical lines arranged at periodic intervals** — to aid in base calling and image registration. These tracklines are areas where the capturing probe was unloaded, and will appear as narrow lines on the spatial feature expression density heat map.
To ensure optimal image registration and analysis, the tissue staining and imaging SOPs for Stereo-seq technology have been carefully designed and tested. These SOPs minimize any impact on downstream mRNA capture rates while enhancing trackline visibility in microscope images. Since tracklines are present in both the density heat map and the microscope image, they serve as precise position markers for aligning images with spatial expression data.
Below are examples illustrating tracklines in both microscope images and the spatial feature expression density heatmap.
{% hint style="info" %}
The images are adjusted to optimize the visibility.
{% endhint %}
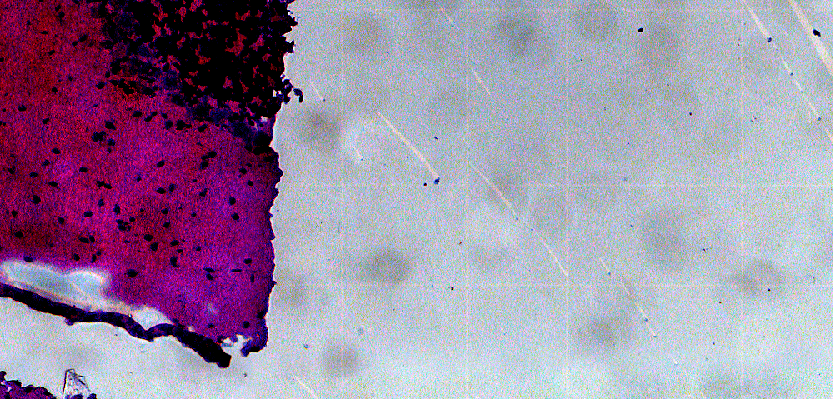
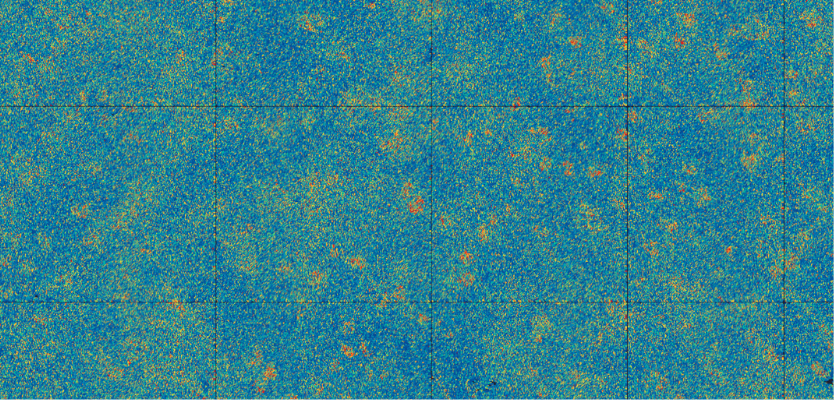
| Tracklines on fluorescence image | Tracklines on color image | Tracklines on density heat map |
| ------------------------------------------------------------------------------------------------------------------------------------------------------------------------------------------------------------------------ | ------------------------------------------------------------------------------------------------------------------------------------------------------------------------------------------------- | --------------------------------------------------------------------------------------------------------------------------------------------------------------------------------------------------- |
|
Tracklines show as black lines.
|
Tracklines show as lighter white lines.
|
Tracklines show as black lines.
|
**SAW** incorporates **automated image processing algorithms** to accurately detect tissue and cell boundaries and identify tracklines on the Stereo-seq chip. These tracklines are essential for aligning microscope images with the spatial feature expression matrix. However, if [**trackline detection**](https://stereotoolss-organization.gitbook.io/stereomap-user-manual-v4.2/navigation-for-tools/stereo-seq-image-qc#trackline-detection) **fails** or **tissue/cell boundaries appear unclear**, manual outlining or alignment may be required to ensure precise image registration.
## Image Processing Roadmap
A recommended image-processing roadmap would be:
1. **Assess the quality of your microscope image.** This step aims to verify the detectability of tracklines, the accuracy of stitched image tiles, and the visibility of tissue structures. This step is a crucial part of the Stereo-seq experiment SOP and involves using the [**image QC**](https://stereotoolss-organization.gitbook.io/stereomap-user-manual-v4.2/tutorials/navigation-for-tools/stereo-seq-image-qc) tool to determine whether the image can be **automatically processed by SAW**. It is highly recommended to perform QC during the experiment to simplify subsequent image analysis. However, QC evaluation is also embedded within the **Image Processing module** for convenience. For detailed evaluation criteria, please refer to the [**Image QC** ](https://stereotoolss-organization.gitbook.io/stereomap-user-manual-v4.2/tutorials/navigation-for-tools/stereo-seq-image-qc)page.
2. **Register image to spatial feature expression density heat map.** Align the microscope image with the spatial feature expression density map, ensuring correct orientation and scaling. If working with multiple immunofluorescence (IF) images, verify the registration of each image individually. Once registered, you can export the **intermediate processing result** (`.tar.gz`) and a **TIFF format registered image** (`.tif`), which can be used with third-party tools or algorithms for further processing, such as segmentation mask generation.
3. **Define tissue and cell boundaries.** Use **interactive drawing tools**, **parameter-adjustable semi-automatic tool**, or **import custom masks created in external software** to define ROI regions. For IF images, weak-intensity areas are likely **background noise**—adjust intensity thresholds to refine ROIs. Thus, pick intensity intervals to specify IF ROIs. Preecise region selection is essential to ensure high-quality data extraction while minimizing background interference.
4. **Export operation recording file** and let SAW generate spatial feature expression matrices for the defined tissue regions or individual cells.
The following pages will demonstrate the step-by-step processing instructions for Stereo-seq support image types. Please follow the guide that matches your request.
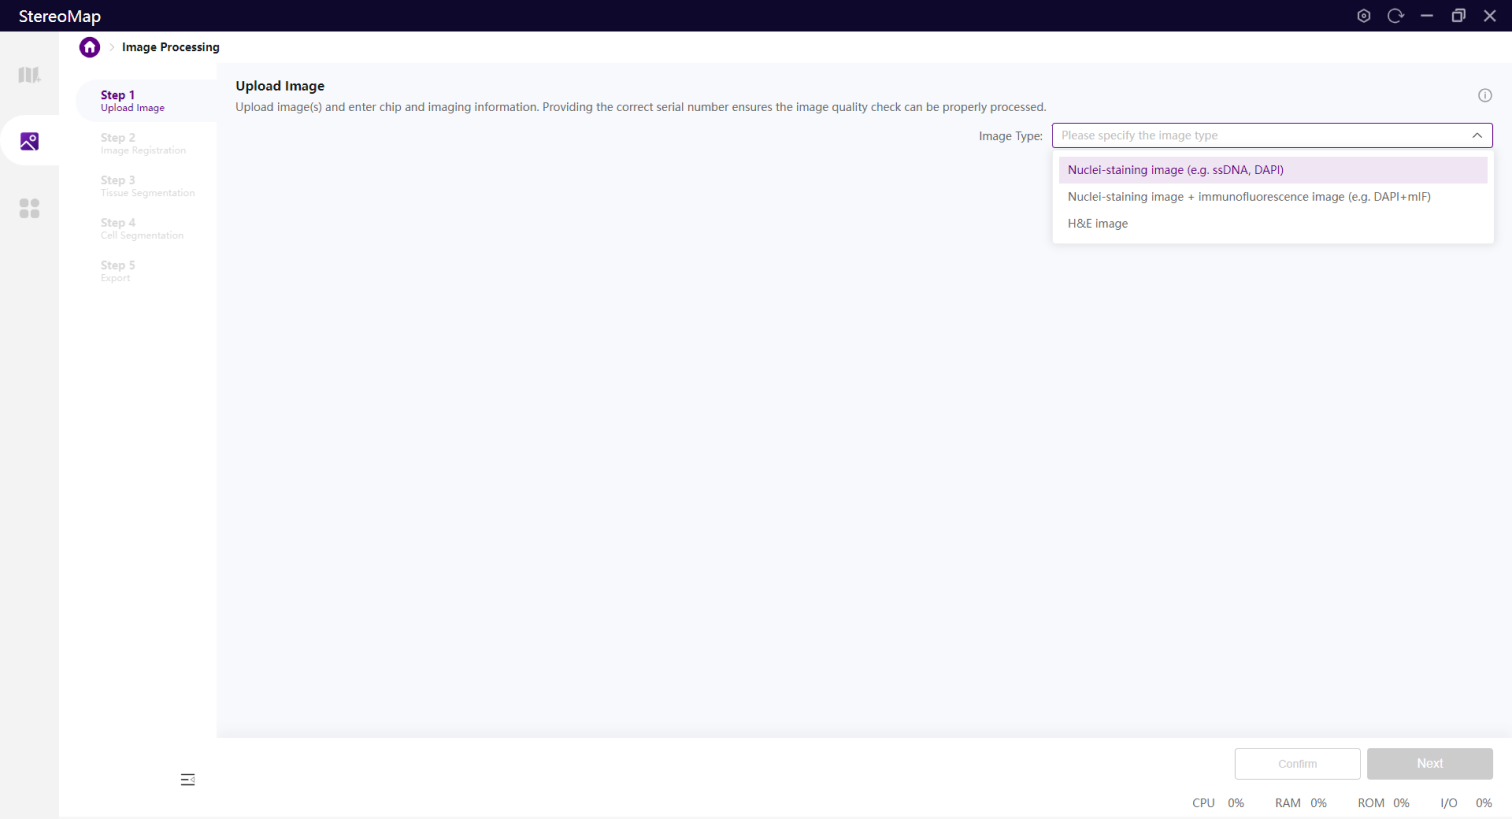
## Accessing Image Processing
StereoMap's Image Processing module can be accessed from the start page.
Image Processing supports three image types, select the one that matches your image.